
Most of the businesses today rely on reliable and scalable software systems to deliver exceptional customer experiences. The two important key practices, Site Reliability Engineering (SRE) and observability, play a crucial role in ensuring the performance of these systems. The expertise in SRE and observability, enable companies to build resilient, efficient, and innovative software solutions.
1.Introduction to SRE and Observability
What is Site Reliability Engineering (SRE)?
Site Reliability Engineering (SRE) is a discipline that combines software engineering practices and systems engineering. It focuses on building and operating highly reliable, scalable systems that can withstand failures and deliver exceptional performance. SRE teams are responsible for ensuring the reliability, scalability, and security of critical software services.
The Role of Observability in Modern Software Systems
Observability refers to the ability to measure the internal state of a system based on its external interactions and outputs, such as logs, metrics, and traces. In modern software systems, observability enables organizations to monitor system performance and detect anomalies, ensuring uptime and optimal user experience. Observability empowers teams to proactively identify and resolve issues, optimize system performance, and make data-driven decisions.
Why SRE and Observability are Crucial for Businesses Today
Businesses mostly depend on complex software systems that must remain operational around the clock. SRE and observability ensure that performance, reliability, and availability are prioritized, which directly impacts customer satisfaction, business continuity, and the ability to scale effectively. SRE proactively monitors and detects issues to prevent downtime and disruptions. It helps in enabling rapid experimentation and feature development with confidence.
2.The Evolution of Observability
Observability 1.0: The Traditional Three-Pillars Model (Metrics, Logs, Traces)
Observability, which originated in control theory, has evolved alongside the increasing complexity of software systems. As systems shifted from monolithic architectures to distributed microservices, observability progressed from Observability 1.0 to 2.0, with each phase differing in methodologies, tools, and objectives.
Observability1.0 traditionally relied on the three pillars:
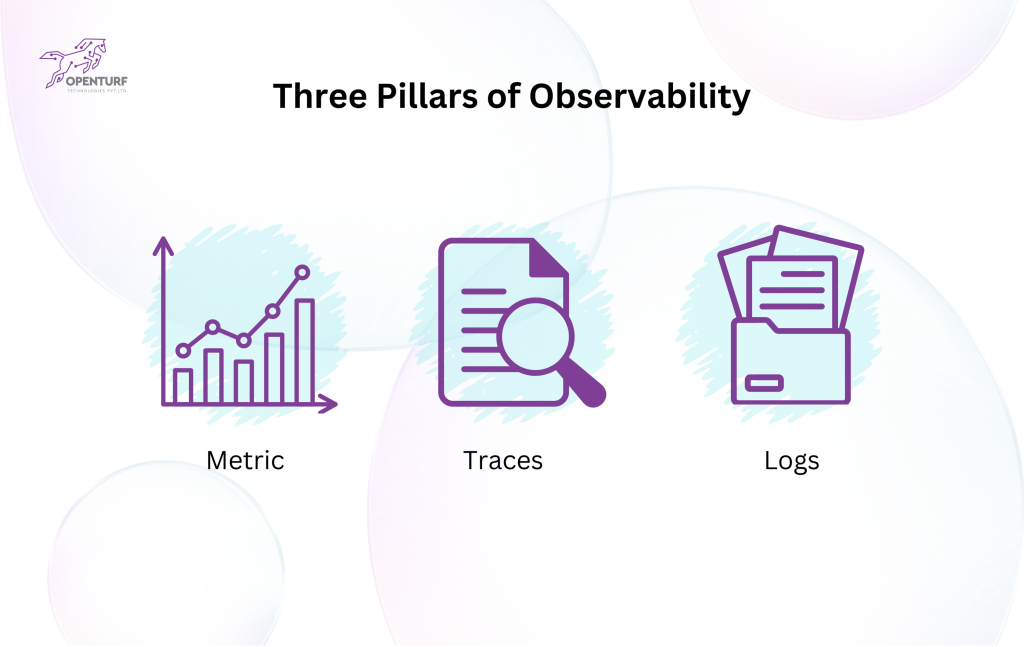
Metrics
A metric is a numerical representation of data that provides insights into the performance, health, or behavior of a system. Metrics are aggregated over time and are ideal for tracking trends and identifying anomalies in a system’s operations.
Example: In a food delivery app, metrics like “average order placement time” or “number of orders per second” can provide insights into system performance. If the average order placement time suddenly spikes, it signals a potential issue in the system that needs investigation.
Metrics are lightweight, providing high-level visibility into system health, but they are limited to predefined data points and cannot capture granular details of individual requests
Traces
A trace represents a sequence of causally related events, capturing the end-to-end flow of a request through a system.
Example: When a user clicks “Place Order” in an e-commerce app, the request might traverse services like authentication, inventory, payment, and order fulfillment. A trace maps out the entire journey of this request.
Logs
A log is a detailed, time-stamped record of discrete events that occur within a system. Logs provide rich contextual information, making them invaluable for troubleshooting and debugging issues.
Example: In an e-commerce app, when a user clicks “Place Order,” a log entry might record the user’s action, details about the inventory check, the payment transaction, and any errors encountered during order fulfillment.
Log Entry: 2025-02-15 10:32:45 – Payment Gateway Timeout – Order ID: 12345
Logs allow engineers to dive deep into specific events or errors, helping them identify exactly what went wrong and where. However, without proper correlation, logs alone don’t provide an end-to-end view of a request’s journey across multiple systems.
The Importance of Data in Observability
Observability hinges on these three key types of data—Metrics, Traces, and Logs—that collectively allow IT teams to detect issues, troubleshoot effectively, and determine the root cause of problems in their systems. Each type of data serves a distinct purpose:
By leveraging all three pillars, teams can gain end-to-end visibility into their systems, enabling faster detection, diagnosis, and resolution of issues.
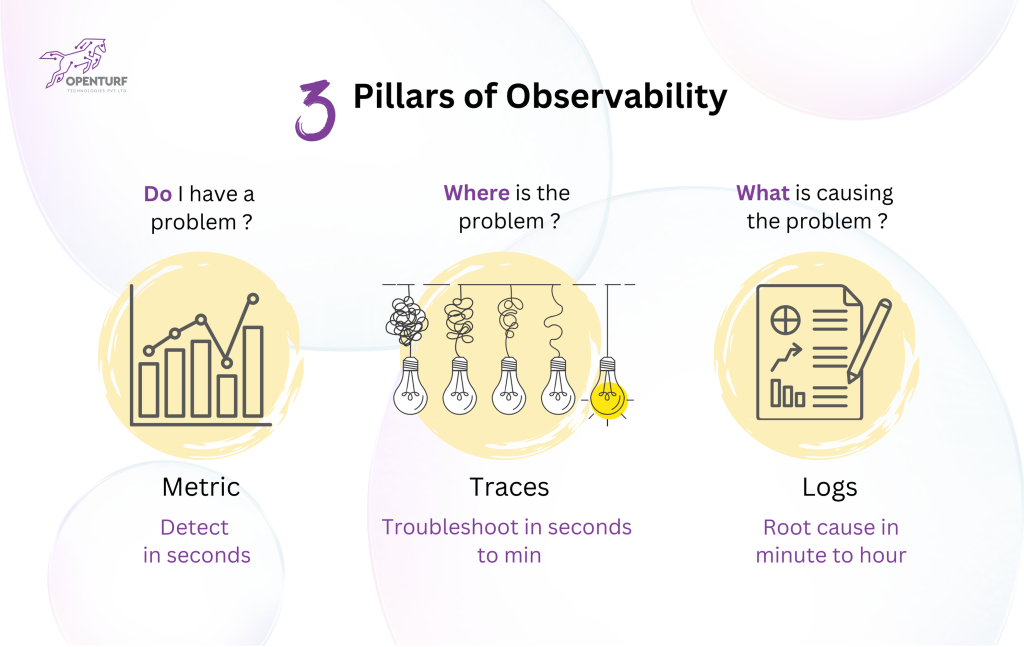
Detect, Troubleshoot, and Root Cause with an Example
Let’s consider a food delivery app to explain these concepts:
- Detect (Metrics)
Metrics indicate system-level performance. For example, an KPI like “average order placement time” exceeds a threshold of 5 seconds. This suggests a potential issue: Do I have a problem?
- Troubleshoot (Traces)
Traces are used to pinpoint where in the system the delay is occurring. For instance, by analyzing the request flow, the trace reveals a bottleneck in the payment gateway API. This answers the question: Where is the problem?
- Root Cause (Logs)
Logs provide granular details. For example, logs from the payment service show that a recent deployment introduced a misconfiguration in the API, causing timeouts. This addresses the final question: What is causing the problem?
Together, these pillars ensure an efficient observability strategy, allowing teams to detect, troubleshoot, and resolve problems quickly to maintain optimal system performance.
3. Full-Stack Observability (Observability 2.0)
Full-Stack Observability refers to the practice of monitoring and analyzing the entire technology stack—from infrastructure and applications to end-user experiences—in a unified, cohesive manner. It goes beyond traditional observability by integrating all layers of the system and focusing on actionable insights tied directly to business outcomes.
Full-Stack Observability vs. Traditional Observability:
| Aspect | Traditional Observability | Full-Stack Observability |
| Scope | Focuses on individual components or systems. | Covers the entire stack, including infrastructure, applications, network, and user experience. |
| Integration | Often uses siloed tools for metrics, logs, and traces. | Combines data into a unified platform for better correlation and analysis. |
| Business Context | Limited focus on business outcomes. | Aligns IT performance with business objectives (e.g., revenue, user satisfaction). |
| End-User Focus | Indirect or absent focus on user impact. | Directly ties system performance to end-user experience and satisfaction. |
| Data Correlation | Requires manual correlation of metrics, logs, and traces. | Automates correlation across data sources for faster root cause identification and issue resolution. |
| Monitoring | Reactive approach, responding to issues after they occur. | Proactively identifies potential problems using AI/ML to predict and prevent failures. |
| Complexity Management | Limited capability to handle modern distributed systems (e.g., microservices, cloud). | Designed to handle complex, dynamic environments like cloud-native and hybrid architectures. |
| Actionable Insights | Provides raw data without direct actionable insights. | Offers actionable insights, such as recommendations for optimization or issue resolution. |
Key Principles of Observability
Understanding Software Through the Lens of Business Goals
Effective observability connects technical metrics with business objectives. This means not only monitoring system health but also ensuring that performance, downtime, and errors align with key business goals such as customer satisfaction, revenue, and user engagement.
Observability data should be used to answer questions that are relevant to business objectives, such as “Is my service meeting SLAs?” or “How can I improve user experience?”
Using Observability as a Tool for Development Feedback Loops
Observability enables feedback loops by providing real-time data that informs development decisions. By continuously tracking application performance, development teams can quickly adjust and improve features, ensuring they meet customer expectations and business needs. Observability data can be used to identify performance bottlenecks, debug issues, and validate changes.
Following are the Core Tenets of Full-Stack Observability
- End-to-End Visibility
- Full-stack observability ensures visibility across all layers of a system, including infrastructure, applications, networks, databases, and end-user interactions.
- It tracks the flow of requests across the stack to provide a complete picture of system behavior and performance.
- Focus on End-User Experience
- Tracks and monitors user interactions to ensure a seamless experience.
- Issues are prioritized based on their impact on end users, ensuring the best possible experience.
- Data Integration Across Silos
- It unifies metrics, logs, and traces into a single platform, enabling seamless correlation and eliminating data silos.
- This integration provides context and actionable insights, reducing the time needed for troubleshooting and root cause analysis.
- Real-Time Monitoring
- Systems are monitored in real-time to identify performance issues, bottlenecks, and anomalies as they occur.
- This enables proactive issue resolution, reducing downtime and its impact on customers.
- Business Context Alignment
- Observability is tied directly to business outcomes, linking technical performance metrics to KPIs such as revenue, user retention, and customer satisfaction.
- This alignment ensures IT teams focus on what matters most to the business.
- Scalability and Adaptability
- Full-stack observability supports modern architectures, including cloud-native, hybrid environments, microservices, and server-less designs.
- It is designed to handle dynamic environments, scaling as systems grow or shrink.
- AI-Powered Insights
- Leverages AI and machine learning to identify patterns, predict potential failures, and recommend optimization strategies.
- This helps teams move beyond reactive monitoring to predictive and proactive management.
- Actionable Insights and Automation
- Provides actionable recommendations for resolving issues and optimizing performance.
- Automates common tasks like alerting, remediation, and reporting to reduce manual overhead.
- Unified Dashboard and Collaboration
- A single pane of glass provides centralized access to data, enabling cross-functional teams (e.g., DevOps, SREs, business stakeholders) to collaborate effectively.
- This eliminates fragmentation and ensures everyone is working from the same set of insights.
- Security and Compliance
- Observability includes robust monitoring for security vulnerabilities and compliance risks.
- It helps organizations detect unauthorized access, anomalies, or breaches, ensuring system integrity.
4. Common Pitfalls in Observability Implementation
Many organizations struggle to implement observability effectively. Here are some common pitfalls to avoid:
- Introducing observability too late in the development cycle: It’s crucial to integrate observability from the early stages of development to ensure that systems are designed for reliability and can be monitored effectively.
- Over-reliance on static dashboards: Static dashboards can be limiting and may not provide the real-time insights needed for effective troubleshooting.
- Neglecting SLOs and error budgets: SLOs and error budgets are critical for defining and measuring service reliability.
5 .Leveraging OpenTelemetry for Flexible and Portable Observability
OpenTelemetry (OTel), an open-source observability framework that offers IT teams standardized tools and protocols for collecting and transmitting telemetry data such as metrics, logs, and traces to monitoring platforms for analysis
A few key benefits of OpenTelemetry are:
- Vendor Neutrality: OpenTelemetry allows you to collect and send telemetry data to various platforms without vendor lock-in.
- Data Flexibility: OpenTelemetry lets you control and filter the telemetry data you send to your platforms, reducing noise and costs while improving organization
- Easy Setup: OpenTelemetry provides an easy setup that saves your organization time and effort by eliminating the need to develop in-house solutions or research individual tools.
6.The Future of Observability and SRE
Trends Shaping the Future
AI Observability
Artificial Intelligence (AI) is increasingly being integrated into observability platforms to provide smarter anomaly detection, automated incident response, and predictive maintenance. AI can analyze massive amounts of data to identify potential issues before they escalate, drastically reducing downtime and improving system performance.
Structured Data
The move towards structured data is enabling easier data aggregation and more meaningful insights across systems. With structured logs and metrics, teams can perform more efficient queries and create more accurate and actionable reports. This shift also improves data consistency, which is crucial for long-term scalability.
Unified Tools
There is a growing trend toward unified observability platforms that combine metrics, logs, traces, and real-time dashboards in a single interface. This consolidation simplifies monitoring, reduces tool sprawl and improves cross-team collaboration.
7. Why Businesses Need to Invest in Observability Now to Stay Competitive
Observability tools enable faster issue detection and resolution, reducing MTTR and enhancing customer experience and operational efficiency. Additionally, observability helps optimize infrastructure and reduce costs by identifying underutilized resources
Improved Decision-Making and Staying Ahead of Competitors:
Observability platforms provide insights into system performance, customer behavior, and operational trends, enabling data-driven decisions and agile responses. Companies with robust observability can quickly address issues, maintain system reliability, and stay competitive.
8.Takeaways and Best Practices
Key Lessons for Businesses Looking to Adopt Observability:
- Start with Clear Objectives: Before diving into observability tools and platforms, businesses must first define what they want to achieve. Whether it’s improving system reliability, reducing downtime, enhancing user experience, or optimizing costs, having clear objectives will guide the selection of appropriate tools and strategies.
- Invest in the Right Tools and Infrastructure: Observability is only effective if the right tools are in place. Businesses should prioritize platforms that integrate seamlessly across their systems and offer comprehensive visibility into logs, metrics, traces, and application performance.
- Prioritize a Holistic View: Observability isn’t just about monitoring a single system component; it’s about gaining end-to-end visibility.
- Implement Proactive Monitoring: Don’t wait for issues to occur before acting. Observability enables proactive monitoring, where businesses can identify early signs of potential issues.
- Iterate and Continuously Improve: Regular updates help ensure that the observability system adapts to new challenges and growth in the organization’s infrastructure.
Practical Tips for Engineering Teams to Align Observability with Business Goals:
- Collaborate with Stakeholders Across Teams: Observability impacts the entire business. Engineering teams should collaborate with other departments to ensure observability goals align with business objectives and deliver measurable value.
- Define and Track KPIs That Reflect Business Impact: Teams should track KPIs that directly affect users to align observability with business priorities.
- Automate Incident Response to Minimize Impact: Integrate automated incident response into your observability setup to reduce manual intervention and focus on improving the overall system.
- Promote a Culture of Continuous Learning: Teams should continuously learn from past incidents to optimize the system and improve observability.
Ready to enhance your system’s reliability and scalability?
OpenTurf specializes in providing custom SRE and observability solutions that enable businesses to confidently monitor, optimize, and scale their infrastructure. Our team of experts can help you improve system uptime, reduce operational costs, and streamline incident response.
Connect with OpenTurf today to learn how our advanced observability solutions can enhance the performance, reliability, and innovation your business needs to thrive.
References:
The article ‘Supercharge Your IT Monitoring’ by Splunk effectively highlights the critical role of data-driven observability in optimizing modern IT systems.